The FEC has a tremendous amount of publicly data available for download, and a really excellent API that allows you to paint a pretty transparent picture of a candidate or PAC’s financial history.
I started this project because I hate Carey committees (also called Hybrid PACs) and wanted to see what share of ActBlue (the largest Democratic fundraising platform) donations went to Hybrid PACs – but I learned a few other interesting things along the way!
Plus a short rant on Hybrid PACs at the end, if you’re curious.
The Data
I downloaded the FEC’s collection of all transactions from the 2019-2020 reporting period – just over 49 million records! Pretty much right about here was where I hit my first hurdle. It turns out, 49 million is a pretty big number, way past too big to load into memory and simply process with a few lines of Javascript.
My initial approach was to process the .txt file containing the transactions line-by-line and for each one, extract the fields I needed and throw it into an SQLite database. However, this proved also to be a pretty slow method, and with the script crashing a few times throughout (and with not very much meaningful error handling on my part) I looked for a slightly faster and less error-prone method.
True to its name, the AWK command line language is pretty awkward, but significantly faster for processing and manipulating delimited values. After a lot of fiddling around, I arrived at the following:
awk -F "|" '{
    abfecid="C00401224"
    if($1 == abfecid) {
      earmarked=substr($20,1,13);
      if(earmarked=="EARMARKED FOR" && $16~/C[0-9]{8}/){
          print $0 >> "out.txt";
      }
    }
}' ./indiv20/itcont.txt
A short enough little script! I only wanted contributions donated to ActBlue, and further only wanted donations that had been “earmarked” to a committee – that is, I didn’t want donations to ActBlue itself, just to other committees through ActBlue.
Once this ran, I had a pared-down list of 21,883,877 contributions. Still way too many to parse in memory! It was time to figure out what type of visualizations I really wanted to do and prepare the data for those.
I figured a good place to start would be to figure out how many donations had been received by each committee, and how much money they’d received in aggregate. That gave me a much more manageable list of 2470 committees. I was finally able to leave AWK behind and write some Javascript to sum up the totals dollars raised per committee, and then queried the FEC API’s Committee endpoint to add a bit of extra info like full committee name and committee type (i.e. House candidate, Senate candidate, PAC, Super PAC, etc.)
The final result is available in this Gist here.
That was it for data prep for at least a few charts! It was time to roll up my sleeves and get visualizing.
Visualizations
At the start of this project, I set out to learn a popular Javascript library that was new to me – D3.js, a widely-used and very powerful data visualization tool.
The steps here are pretty uninteresting, since I didn’t do anything groundbreaking besides reinventing the bar and pie charts, but after a lot of tinkering I ended up with some neat graphs!
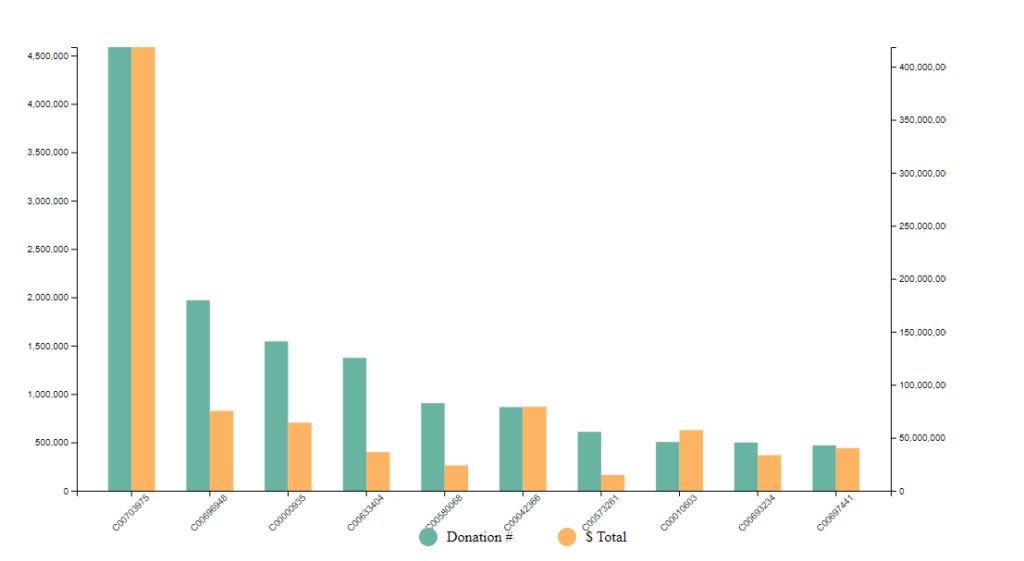
The first thing I wanted to do was simply visualize the data as it was in my pre-compiled csv file — what were the top 10 committees by donation count and how much did they raise in the 2019-2020 year?
The chart above visualizes the answer to that question, summarized also in the table below:
| FEC ID | Donations | Total Amount | Name | Committee Type |
|---|---|---|---|---|
| C00703975 | 4,586,857 | $418,473,050 | BIDEN FOR PRESIDENT | Presidential |
| C00696948 | 1,969,295 | $75,340,397 | BERNIE 2020 | Presidential |
| C00000935 | 1,543,879 | $64,347,349 | DCCC | Party – Qualified |
| C00633404 | 1,374,484 | $36,445,742 | STOP REPUBLICANS | PAC with Non-Contribution Account – Nonqualified |
| C00580068 | 905,697 | $23,898,834 | PROGRESSIVE TURNOUT PROJECT | PAC with Non-Contribution Account – Qualified |
| C00042366 | 865,102 | $79,232,445 | DSCC | Party – Qualified |
| C00573261 | 609,204 | $14,971,717 | END CITIZENS UNITED | PAC – Qualified |
| C00010603 | 504,153 | $57,179,260 | DNC | Party – Qualified |
| C00693234 | 499,239 | $33,582,614 | WARREN FOR PRESIDENT, INC. | Presidential |
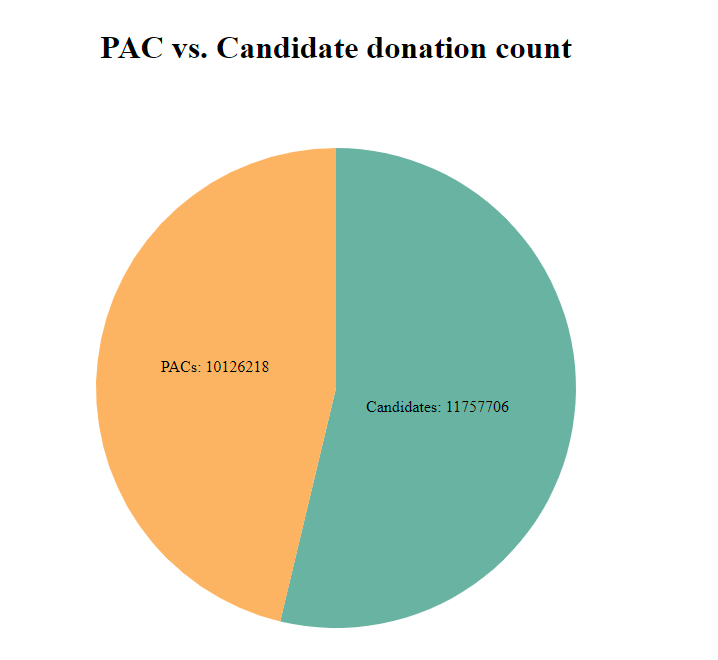
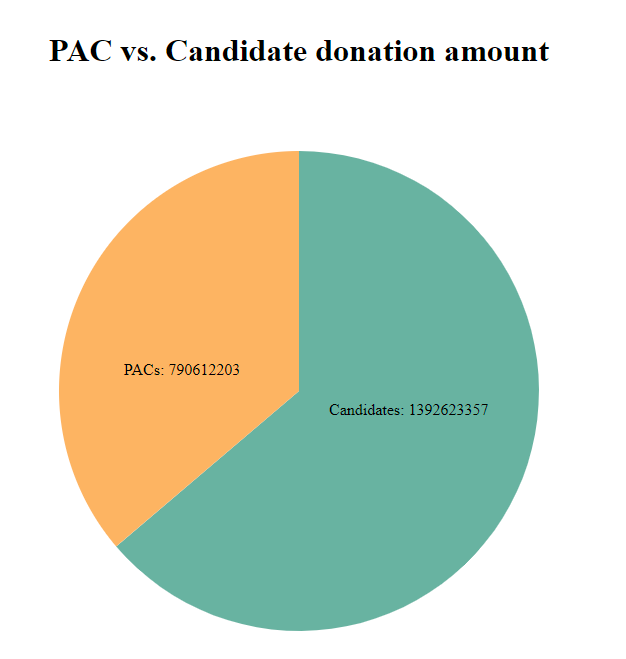
The next couple of questions I wanted to answer were: how much went to PACs and how much went to Candidates, both in terms of number of donors and raw dollar count?
It was a pretty even split, but candidates won out in both cases (probably due in part to Joe Biden’s absolute walloping of every other committee in the dataset).
Here again are the same data represented in charts:
Donation count by type
| Type | Donation Count | Percent |
| Candidates | 11,757,706 donations | (53.7%) |
| PACs | 10,126,218 donations | (46.3%) |
| Total | 21,883,924 donations | (100%) |
Total Raised by type
| Type | $ Raised | Percent |
| Candidates | $1,322,623,357 | (65.1%) |
| PACs | $709,612,203 | (34.9%) |
| Total | $2,032,235,560 donations | (100%) |
Finally, I did some back of the napkin math (my patience for hand-coding charts was dwindling) to figure out the answer to my original question.
Carey Committees/Hybrid PACs netted about 10% of all dollars in 2019-2020, and about 17% of all donations.
That was actually a lot less than I expected! Which is good, because…
(rant incoming)
A brief note on why Hybrid PACs are evil
Campaign contribution limits exist for a lot of good reasons, but a good enough one is that it stops corruption. Campaigns are really expensive, and often you have to spend money to make money, which is a big problem for campaigns that don’t have a lot of money to begin with. And your opponents being better off than you are is a huge problem for small campaigns, because it makes it even harder to compete in ad marketplaces and all the other ways you might reach donors.
If your opponent in a Congressional race could get a single $5 million check from a local oil tycoon or tech mogul because they were perceived to be a better candidate for the industry, you’re going to have a hard time competing against their bids for ad space. You’re going to have a hard time getting your message out, fundraising to support yourself and paying bills through a lengthy cycle. And you’re just going to have a bad time.
So we don’t let people bankroll campaigns like that. Except it turns out that some people (including a majority of Supreme Court justices most recently surveyed) believe money = speech, so it was untenable to simply regulate private citizens from spending money ton influence elections.
So, Super PACs exist as a way for that (increasingly less hypothetical) big executive spender to drop an unlimited amount of money to influence the election, but with the crucial caveat that Super PACs cannot coordinate with a candidate or give money to them directly. For people like me who don’t enjoy money’s existing and overwhelming role in politics, this isn’t ideal. But it’s not terrible, as long as there actually is no coordination between the Super PACs and candidates (spoilers: there often is).
But then enter Hybrid PACs. Hybrid PACs are essentially a normal PAC (which can give money to candidates and coordinate with them directly) plus a Super PAC rolled into ONE organization — with the sole caveat that there’s merely a separate bank account to hold the Super PAC money.